

Approximately 30 million adults in the United States have been diagnosed with chronic kidney disease, or CKD. The conditions categorized under CKD can damage the kidneys, decreasing their ability to function accordingly. Patients with this health issue can develop high blood pressure, anemia, weak bones, nerve damage and overall poor health. Chronic kidney disease may also increase a patient's risk of developing heart and blood vessel disease, although these complications may occur slowly over time.
Chronic kidney disease may be caused by diabetes, high blood pressure and a variety of other disorders. Early detection and treatment is important to prevent CKD from getting worse. Chronic kidney disease may lead to kidney failure which may require additional care to maintain the patient's quality of life. The purpose of the article below is to demonstrate the accurate prognosis and life expectancy of patients with chronic kidney disease. The evidence on the prediction of how long patients with CKD are expected to live provides important new data which may be useful for treatment.
Abstract
Can renal prognosis and life expectancy be accurately predicted? Increasingly, the answer is yes. The natural history of different forms of renal disease is becoming clearer; the degree of reduction in glomerular filtration rate (GFR) and the magnitude of proteinuria are strong predictors of renal outcome. Actuarial data on life expectancy from the start of renal replacement therapy are available from renal registries such as the U.S. Renal Data System (USRDS), and the UK Renal Registry. Recently, similar data have become available for patients with chronic kidney disease. Data collected from a large population-based registry in Alberta, Canada and stratified for different levels of estimated GFR (eGFR) have shown that the reduction in life expectancy with kidney failure is not a uremic event associated with starting dialysis but a continuous process that is evident from an eGFR of ≤60 ml/min. Nevertheless, despite the poor prognosis of the last stages of renal failure, progress in the treatment and management of these patients and, in particular, of their cardiovascular risk factors continues to improve long-term outcome.
Keywords: Adolescent, Chronic kidney disease, Progressive renal failure, Life expectancy, CAKUT, End-stage kidney disease
Introduction
How much do we know about renal prognosis and life expectancy in adolescents with chronic kidney disease (CKD)? If one sees a new patient, a 19-year-old youth with a serum creatinine level of 200 μmol/l, can one predict his likely renal prognosis and his life expectancy? The answer is yes, and this is frequently done when the question is posed in a medico-legal context; however, is the answer accurate?
We know that life expectancy is much reduced with end-stage renal failure—but what about the different degrees or stages of renal failure? For this review I have searched the adult and paediatric literature for papers cited in PubMed and Google Scholar that might contain data on life expectancy with CKD, or for series that have followed patients with CKD from childhood to end-stage kidney disease (ESKD) and through to renal replacement therapy (RRT). I summarise the evidence on the prediction of renal prognosis, describe important new data from Canada that for the first time looks at life expectancy with different stages of CKD and cite the U.S. Renal Data System (USRDS) and UK renal registries that report annual data regarding life expectancy with RRT.
Predicting Renal Outcome
To predict renal outcome I first make a number of assumptions. On the balance of probabilities (medico-legal language for a >50 % chance), at this age (19 years) the patient will have some form of renal dysplasia that would fall under the general heading of congenital anomalies of the kidney and urinary tract (CAKUT)—or some other congenital disease that might be tubular. If my history and examination make both of these possibilities unlikely, then further investigation is required which might include a biopsy.
If the patient has no proteinuria (protein creatinine ratio <50 mg/mmol), then the renal function should be currently stable. Renal deterioration will not occur until there is increasing proteinuria [1–5]. The exception to this would be a pure tubular disease, and I am assuming that this disease will have been picked up during the history, examination and other basic investigations.
Patients with inexorably progressive renal failure tend to deteriorate at a rate proportional to their proteinuria [6], but generally speaking the more proteinuria, the more the rate of progression can be slowed by angiotensin converting enzyme inhibitors (ACEIs) and good control of blood pressure [2, 7–9].
Patients with small asymmetric kidneys (renal hypodysplasia—often described in the UK as reflux nephropathy) tend to deteriorate at the slowest rates, and this is rarely greater than an estimated glomerular filtration ration (eGFR) of 3–4 ml/min/1.73 m2/year [3, 7]. Studies by of our own group have shown that controlling blood pressure and reducing proteinuria with an ACEI should reduce the rate of loss down to around 1.5 ml/min/1.73 m2/year [2, 7].
Assuming that the 19-year-old patient with a serum creatinine level of 200 μmol/l has an eGFR of 35 ml/min/1.73 m2 and that he will need dialysis when his eGFR is around 10 ml/min/1.73 m2, then he should reach ESRD in approximately 17 years [(35 − 10) divided by 1.5 years]. If he were to lose function at the faster rate of 3 ml/min/year, this would be 8.3 years.
Chronic kidney disease (CKD) is characterized by the gradual loss of kidney function over time. If kidney disease becomes worse, it may lead to kidney failure, requiring dialysis or a kidney transplant to maintain life. The following article demonstrates that life expectancy in patients with chronic kidney disease can be predicted. While it's known that life expectancy in patients with end-stage renal failure is reduced, life expectancy in patients with different degrees or stages of renal failure shouldn't necessarily be affected. Kidney function outcome predictions are not a patient's destiny but an option for how long they are expected to live.
Dr. Alex Jimenez D.C., C.C.S.T.

Life Expectancy with CKD
Life expectancy tables for people with CKD have been created from a large population-based registry in Alberta, Canada and stratified for different levels of eGFR [10]. Data are calculated for men and women from 30 years of age to age 85 years by their levels of kidney function as defined by eGFRs of ≥60, 45–59, 30–44 and 15–29 ml/min/1.73 m2 (see Table 1) [10]. These data show that life expectancy is progressively reduced with each age band of worse renal function.
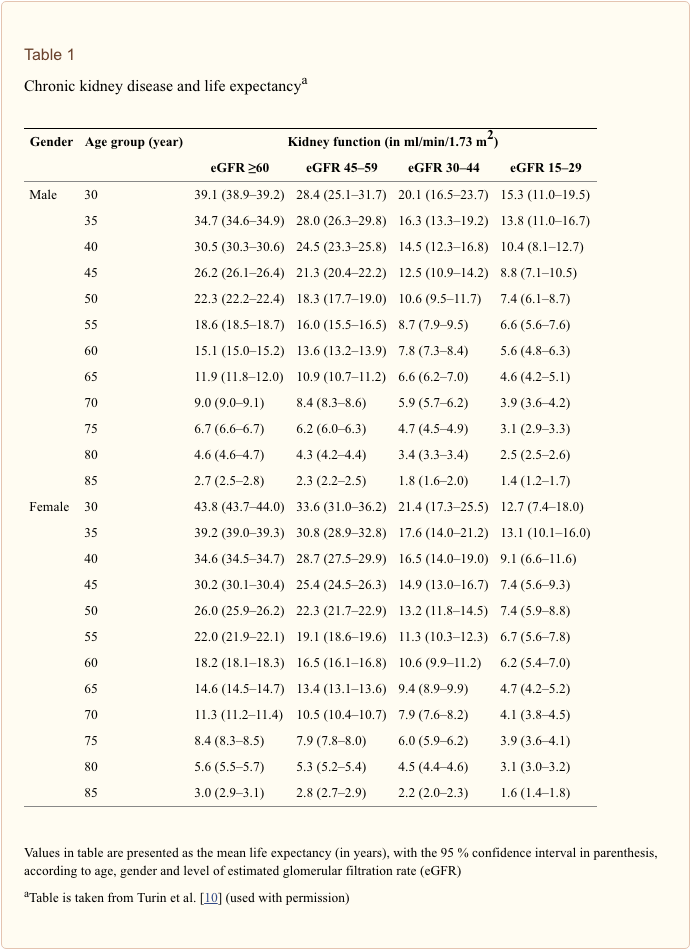
The excess mortality associated with renal failure is due principally to the increased risk of cardiovascular disease. An investigation of the causes of death associated with CKD in Alberta revealed that the major cause of death was cardiovascular (including an increase in heart failure and valvular disease). The unadjusted proportion of patients who died from cardiovascular disease increased with decreasing eGFR [21, 37, 41, and 44 % of patients with an eGFR of ≥60 (with proteinuria), 45–59.9, 30–44.9, and 15–29.9 ml/min/1.73 m2, respectively]. The proportion of deaths from infection also increased but not those from cancer [13].
In a separate review using meta-analysis to examine the influence of both reduced eGFR and albuminuria on cardiovascular mortality the authors found that both lower eGFR (<60 ml/min/1.73 m2) and higher albumin/creatinine ratio (ACR ≥10 mg/g) were independent predictors of mortality risk in the general population [14]. Adjusted hazard ratios (HRs) for all-cause mortality at eGFRs of 60, 45 and 15 ml/min/1.73 m2 (vs. 95 ml/min/1.73 m2) were 1.18 [95 % confidence interval (CI) 1.05–1.32], 1.57 (95 % CI 1.39–1.78) and 3.14 (95 % CI 2.39–4.13), respectively. The ACR was associated with mortality risk linearly on the log-log scale without threshold effects. Adjusted HRs for all-cause mortality at ACRs of 10, 30, and 300 mg/g (vs. 5 mg/g) were 1.20 (1.15–1.26), 1.63 (1.50–1.77) and 2.22 (1.97–2.51), respectively. These data are derived from populations a higher mean age, but age was not an independent variable.
Thus, our patient, aged 19–36, even with an eGFR of approximately 45 ml/min/1.73 m2, has an increased risk of dying of around 57 % [risk ratio (RR) 1.57] compared with an eGFR of 95 ml/min/1.73 m2; similarly, with a ACR of 30 mg/g, our patient has an increased risk of dying of around 63 % (RR 1.63) compared with ACR of 5 mg/g [14]. These figures correlate with life expectancy tables [10] in which a 30-year male with an eGFR of 30–44 ml/min/1.73 m2 has a life expectancy reduced by approximately 50 % compared with a similar patient with an eGFR of ≥60 ml/min/1.73 m2.
To this equation we should also consider modification of life expectancy by such factors as race, gender and socio-economic status [15, 16], as well as control of blood pressure and hyperlipidemia [17]. All of these factors are being studied in the ongoing Chronic Kidney Disease in Children (CKiD) Study.
Predicting Life Expectancy at End-Stage
If our patient is well looked after for the next 17 years, I will assume that he will not die before he reaches ESRD at the age of 36 (age 19 + 17 years at a GFR decline rate of 1.5 ml/min/1.73 m2/year). However, we now know that this assumption cannot be made. As we have seen from the Canadian data, even at age 19 years with a GFR of 35 ml/min/1.73 m2, we can extrapolate that his life expectancy is reduced by around 50 %. For a UK male aged 19 years, a life expectancy of 61.4 years [11] is reduced to 30 years (age 49 years) [10].
Assuming that our patient would be around 36 years of age when end-stage renal failure is reached, then one can use two sources of actuarial information regarding future life expectancy:-
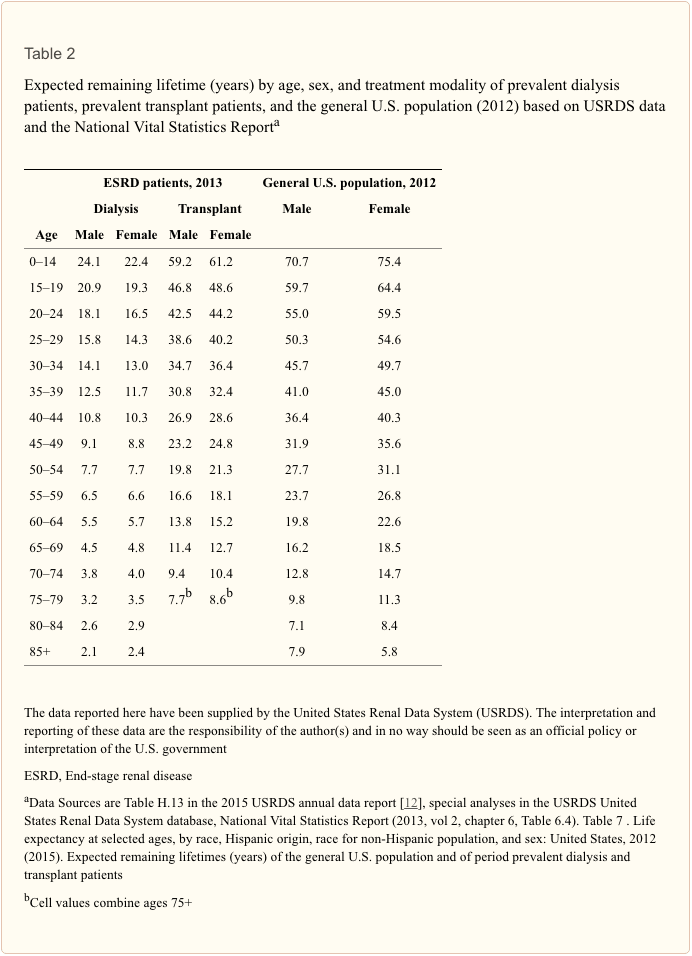
- The USRDS Annual Report’s chapter on mortality and survival has actuarial tables which show data in 5-year age bands [12] (Table 2). Thus, at 36 years of age, our patient falls into the age band 35–39 years. This shows us that a normal U.S. male of this age group can expect to live a further 41 years. The same age group will live a further 12.5 years on dialysis and 30.8 years after a successful transplant. Of course, in reality, RRT life will tend to be a mixture of the two modes.
- The UK Renal Registry annual report chapter on survival also has actuarial data in 5-year age bands [18]. However, these show that the median life expectancy for patients starting RRT at the 90-day time point and for this age group (35–39 years) is a further 13.5 years (dialysis and transplant combined).
- In comparison, the Canadian data show that at age 35 years with an eGFR of 15–29 ml/min/1.73 m2, the remaining life expectancy is +13.8 years [10].
Trends in Life Expectancy
A review of annual reports from the USRDS in the period 1996–2013 reveals that the life expectancy for a 36-year-old man on haemodialysis has improved steadily and linearly from 7.2 years in 1996 to 11.5 years in 2013 (see Fig. 1). Thus, one can anticipate that our current projections of life expectancy probably err on the pessimistic side of reality. This is supported by a detailed analysis of paediatric outcome over the period 1990–2010 [19].

Summary and Conclusions
We can now predict renal outcome and life expectancy with some accuracy, but data sources on life expectancy are few. The new information from Canada on life expectancy with CKD is very important but will need verifying from other parts of the world. We must not forget that collected data are often a decade old before they are analysed and published. While several long-term studies like CKiD [15–17] are running, it is still too early for them to have generated new information on life expectancy. However, trends in outcome continue to improve, suggesting that we can be more optimistic than current data suggest.
Summary Points
- Life expectancy is reduced for all levels of renal function below an eGFR of 60 ml/min/1.73 m2.
- Actuarial data are now available on life expectancy both for patients with chronic kidney disease and end-stage kidney disease.
- The increased risk of premature death is principally related to the increase in cardiovascular morbidity.
Questions (Answers Provided Below)
- Proteinuria predicts progressive renal failure if greater than:
a. 50 mg/mmol creatinine (0.5 g/d)
b. 100 mg/mmol creatinine (1.0 g/d)
c. 150 mg/mmol creatinine
d. 200 mg/mmol creatinine - Life expectancy is reduced when eGFR falls below:
a. 60 ml/min
b. 50 ml/min
c. 50 ml/min
d. 30 ml/min - Life expectancy on dialysis in USA has stopped increasing
a. Since 2000
b. Since 2005
c. Since 2010
d. Is still increasing - The increased relative risk of dying in young patients with CKD is:
a. Cardiovascular
b. Cancer
c. Infection
d. None of these
Acknowledgements
Particular thanks to Retha Steenkamp and UK Renal Registry for their generous help and advice.
Compliance with ethical standards
Conflict of Interest
The author declares no conflict of interest
Footnotes
Answers:
- a
- a
- d
- a
In conclusion, the prognosis and life expectancy predictions for patients with CKD don't guarantee how long a patient with CKD is expected to live. Instead, these statistics may be useful towards determining an alternative treatment option which may help change these outcomes in patients with CKD. Information referenced from the National Center for Biotechnology Information (NCBI). The scope of our information is limited to chiropractic as well as to spinal injuries and conditions. To discuss the subject matter, please feel free to ask Dr. Jimenez or contact us at 915-850-0900 .
Curated by Dr. Alex Jimenez
Referenced from: Ncbi.nlm.nih.gov

Additional Topics: Acute Back Pain
Back pain is one of the most prevalent causes of disability and missed days at work worldwide. Back pain attributes to the second most common reason for doctor office visits, outnumbered only by upper-respiratory infections. Approximately 80 percent of the population will experience back pain at least once throughout their life. The spine is a complex structure made up of bones, joints, ligaments, and muscles, among other soft tissues. Because of this, injuries and/or aggravated conditions, such as herniated discs, can eventually lead to symptoms of back pain. Sports injuries or automobile accident injuries are often the most frequent cause of back pain, however, sometimes the simplest of movements can have painful results. Fortunately, alternative treatment options, such as chiropractic care, can help ease back pain through the use of spinal adjustments and manual manipulations, ultimately improving pain relief.